Visualizing the Chain: Corporate Hierarchy Visualization in Secure Enterprise Networks
July 28, 2026 · Jogajog team · 3 min read

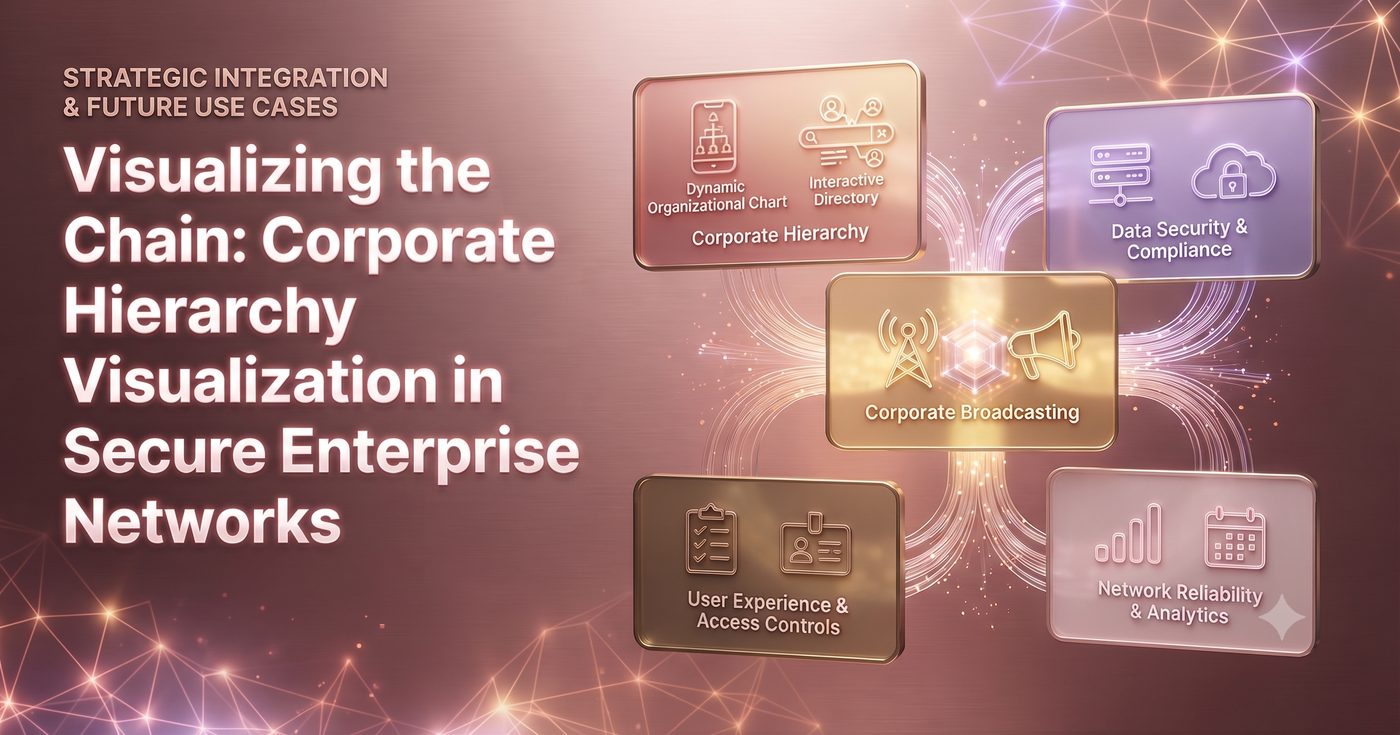
In the complex and multifaceted environment of modern multinational corporations, large financial institutions, and multi-branch enterprises—such as coordinating chief executive officers, corporate HR directors, organizational development leads, and administrative heads across regional headquarters in Dhaka, commercial centers, and international branches—maintaining a clear and transparent organizational structure is vital for streamlined governance. When organizations rely on static organizational charts, fragmented departmental lists, or outdated internal directories to manage complex reporting lines and corporate hierarchies, it results in critical communication bottlenecks, role confusion, and severe administrative delays. The definitive key to elevating organizational transparency and management efficiency is implementing robust corporate hierarchy visualization within a unified enterprise communication network.
The Challenge
How can enterprise HR directors, organizational architects, and IT leaders design and deploy a centralized, mobile-accessible directory and communication framework that dynamically visualizes complex reporting lines, multi-tiered management chains, and departmental relationships without compromising corporate data governance or system security?
The Problem with Static Organizational Charts and Disconnected Directories
Attempting to manage corporate reporting structures using outdated, uncoordinated methods introduces critical vulnerabilities:
* Role Confusion and Communication Bottlenecks: Relying on static PDFs or outdated intranet charts leaves employees struggling to identify key decision-makers and direct reporting lines, slowing down project approvals.
* Administrative Overhead in Restructuring: Updating corporate hierarchies manually across disconnected software tools drains human resources and leads to widespread synchronization errors.
* Security Risks with Unverified Access: Exposing sensitive corporate organizational charts and executive contact details through unsecured third-party applications creates severe data leakage and compliance vulnerabilities.
The Solution: Dynamic Structural Mapping and Encrypted Collaboration Hubs
Transitioning to an advanced, enterprise-grade communication and directory platform—like Jogajog—replaces organizational ambiguity with a structured, interactive, and secure ecosystem. By optimizing corporate hierarchy visualization, enterprises ensure:
* Dynamic Mobile Organizational Charts: Enable instant, searchable, and interactive visualization of multi-tiered reporting lines, departmental trees, and executive contacts directly within mobile enterprise directories.
* Encrypted Enterprise Governance Vaults: Establish secure, end-to-end encrypted communication channels and data repositories for executive leadership, board members, and human resources teams.
* Granular Role-Based Access Controls (RBAC): Grant staff, managers, and department heads access only to the directory fields, organizational charts, and communication tiers relevant to their specific clearance level.
Frequently Asked Questions
Q: Why do traditional static organizational charts fail to support modern enterprise needs?
A: Static charts become outdated almost immediately during organizational restructuring. They lack interactive search capabilities and real-time updates, leading to communication bottlenecks and confusion regarding direct reporting lines.
Q: How do secure enterprise platforms streamline corporate hierarchy visualization?
A: Modern enterprise platforms provide dynamic, mobile-accessible organizational mapping tools integrated directly with secure communication directories and role-based access controls. This ensures that employees can easily navigate reporting structures while keeping sensitive corporate metadata strictly protected.
See this feature with your own data.
Free branded demo, built from your spreadsheet, this week.
Get your free demo